Why You Shouldn’t Use Sports Trading Strategies Found on YouTube
Introduction: The Allure of the “Easy” Edge
If you have ever searched for profitable sports trading strategies, this will be familiar to you. The thumbnails feature shocked faces and green profit screens, promising a “90% Strike Rate” or a “Secret System” that beats the bookies. These “guru-style” videos are incredibly appealing. They offer a shortcut to profitability without the hard work.
But there is a catch. If these strategies are so profitable, why are they being given away for free? And more importantly, why do they seem to stop working the moment you start using them?
The answer isn’t just bad luck—it’s bad science. In this post, we are going to discuss the only way to validate a system: the 70/30 Split Test with P-value analysis.
Why Most “Guru” Sports Trading Strategies Fail in the Long Run
Most YouTube strategies suffer from a fatal flaw known in data science as Overfitting (or data dredging).
When a content creator creates a strategy, they often look at past results and tweak the rules until the graph goes up. They might say, “Let’s only bet on Home Underdogs in the Premier League, but only if they played on a Tuesday.”
By adding enough specific rules, you can make any historical data look profitable. But this isn’t a prediction of the future; it’s just a description of the past. When you apply these rigid rules to tomorrow’s games, the “edge” disappears because it was never real—it was just random noise that they mistook for a pattern.
The Solution: How to Scientifically Test Sports Trading Strategies with CGMBet
To separate luck from skill, we need to move away from Excel sheets and budget level trading tools and into robust database software like CGMBet. This tool allows us to access years of historical match data and realistic odds, allowing for “Blind Testing.”
Instead of checking if a strategy was profitable, we need to test if it will be profitable. We do this using a standard data science method: The 70/30 Split.
Step 1: The Training Set (70%)
To test a strategy properly, we take our total historical data (e.g., the last 10 years of football matches) and isolate the first 70% (the oldest 7 years).
This is our Training Set. We use this data to find our rules. We can tweak parameters, filters, and odds ranges here as much as we like. Once we have a strategy that looks profitable over these 7 years, we lock the rules in place.
Step 2: The Validation Set (30%)
This is where the YouTube Gurus fail. We now take those locked rules and apply them to the remaining 30% of the data (the most recent 3 years)—data the system has never seen before.
If the strategy was just “curve-fitted” or lucky, the profit line will usually flatten or crash immediately in this 30% segment. If the strategy has a genuine edge, the profit trend should continue.
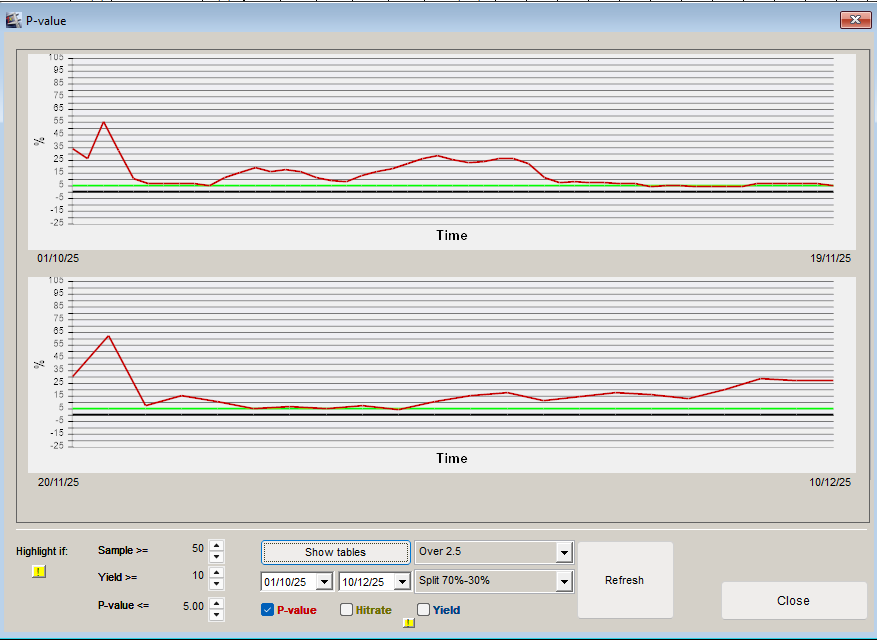
Beyond ROI: Evaluating Sports Trading Strategies with P-Values
Even if a strategy makes money in the 30% validation set, how do we know it wasn’t just a lucky streak? This is where the P-Value comes in.
In simple terms, the P-Value measures the probability that your results happened by pure chance.
- A high P-Value (e.g., 0.10 or higher): There is a high chance your results are just luck.
- A low P-Value (e.g., < 0.05): There is less than a 5% chance this result is a fluke. This is “Statistically Significant.”
Many guru strategies rely on small sample sizes (e.g., “I won 8 out of 10 bets!”). Mathematically, this has a massive P-Value—it means nothing. Using CGMBet, we can generate thousands of bets in our test, driving the P-Value down and giving us mathematical confidence that the edge is real.
Conclusion: Building Sustainable Sports Trading Strategies That Actually Work
The next time you see a video promising a holy grail strategy, ask yourself: Did they validate this on unseen data?
If they only show you a backtest of the past without a blind validation phase, you aren’t looking at a strategy; you’re looking at history. By using tools like CGMBet and adhering to the 70/30 split, you protect your bankroll from the illusion of profit and focus on the long-term reality of sports trading. Finding long term profitable strategies is hard. Why not give it a go and see how you get on.


Pretty much spot on Craig.
How do I apply this to a horse racing database where I apply my filters beforehand to get my outputs? How do I know where the 70/30 sample line is if I don’t have full access to the dataset? I could sample 7 years and then apply again to the next 3 years but it still wouldn’t be a strict 70/30 split due to yearly fluctuations.
If I had a 10 year dataset I would use 5 years for training and 5 for validation but would use alternate years, so 2016,18,20,22, and 24 for training and 2017,29,21 23,25 fir validation.