The smartest soccer simulator you will ever need
The Lessons in Logic soccer simulator really is the smartest soccer simulator you will ever need. This beautiful piece of kit was developed in April 2025 as I was getting frustrated that there was nothing on the market that would give me an indication how a game was likely to play out. The existing simulators were good for getting a feel of how the market reacted after a goal, but that was all they were good for. You couldn’t plan a strategy based on random games with the result occurring once. I needed confidence how a team would perform over many thousands of games. This was not possible to do with any existing software, so I built my own. You can test out a previous version of the simulator for free on this site.
The soccer simulator life cycle
The first versions of the soccer simulator were very primitive. They did the job but were slow. Even when I changed the code to speed it up, it was still slow. It could only go as fast as the display would allow. Early versions had odds graphs included but once the speed increased, these graphs became obsolete. As nice as they looked, I never really trusted them implicitly. What I was finding though was that the outputs from the simulator were really accurate in most cases.
This was exciting and I knew I had to keep going. More metrics were added and endless calculation tweaks and mathematical theory use as I strived to get the software to be even more accurate. By the time we reached version 5 in late July, the software was almost complete. There was just one major change to make, to speed it up beyond all recognition.
A new engine was used which ran all simulations in the background and displayed all the results once the simulations had run. What had initially started off at a top speed of 1000 simulations in 9 minutes, now was able to run 100,000 simulations in 3 seconds. This was the major breakthrough I wanted. This version was so good, a new version hasn’t been released in the past 3 months. In the previous 3 months, five versions were released.
What does the software do?
Team setup
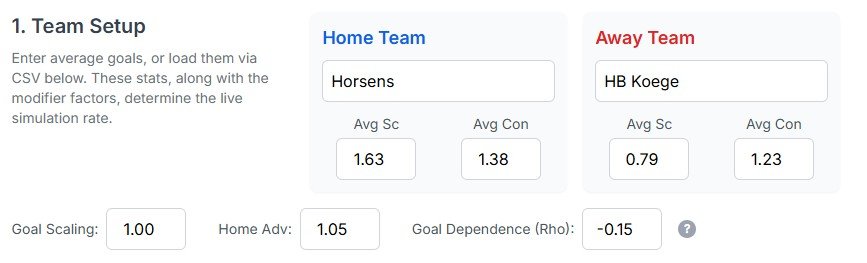
The software can run on manual entries or via a CSV file. The manual route, whilst adequate, will not contain any of the pre-match odds for comparison. These are only available from the CSV file. You can enter the team names and the average goals for and against for both teams. The goal scaling can be altered if you think there will be more goals than the simulator predicts.
You can also change the home advantage factor too if you think the home team will be more dominant than the data suggests. Finally, we have the Goal Dependence rating. A setting of -0.15 is standard for a normal game of football. Values should range from -0.2 for an ultra defensive game to 0.1 for a chaotic goal-fest.
The easiest way to get data into the simulator is via an export from CGMBet. This will automatically fill in all on-screen fields, plus it will also bring in the odds for the main markets and the league averages for goals which will make the calculations more accurate.
Initial odds
As mentioned above, if you import the data from CGMBet, the initial match odds will automatically get loaded into the software. This allows you to check the final results to see if you are getting value or not (as far as the simulator sees it). The results of this exercise should not be used in isolation. It should be part of an informed decision and not the only criteria. Sometimes, early season games can cause some strange results with the simulator as the averages have not had a chance to settle down.
Run Simulation
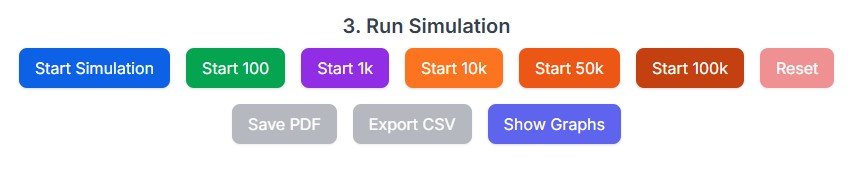
So you have all of your data loaded and you want to see what results the simulator comes up with. We can run the simulator with many options. You can run the selected game through once, 100 times, 1,000 times, all the way up to 100,000 times. In version 5 and version 6 beta, this is super quick.
Once the simulations have completed, you have the opportunity to save the output as a nicely formatted PDF document of as a CSV file which can be loaded into Excel or Google Sheets for further analysis.
Reading the results
It is all well and good being super quick, but the key to the success of the simulator is the accuracy in it’s results. These are displayed over a series of graphical and tabular widgets.
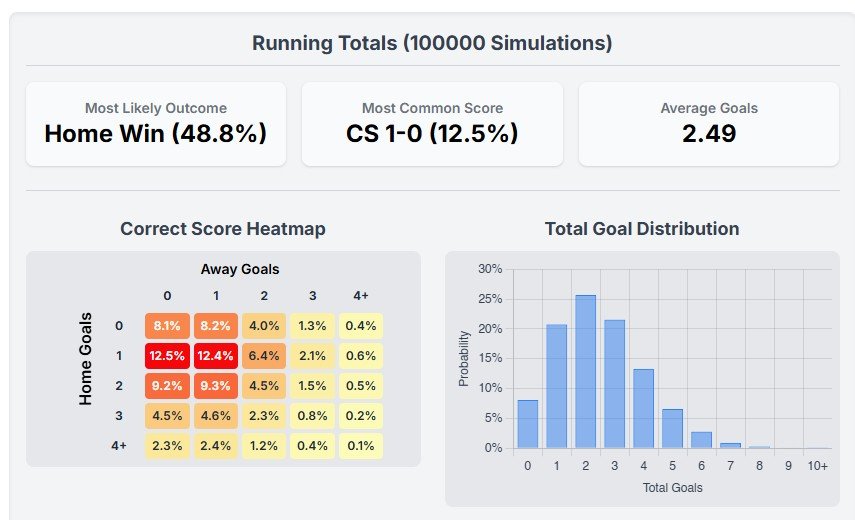
The summary panel gives you a quick overview of which result is most likely and how many times that result occurred in the simulations you have just run. The same applies for the correct score. The final figure in this section is the average number of goals scored across all simulations.
The next section shows the correct score heatmap. More common scores are shown in red, going through orange, right down to pale yellow for scores that do not occur that often. In the example we can see that 1-0 (home team on the y axis away team on the x axis) occurs 12.5% of the time, followed by 1-1 occurring 12.4% of the time. We can also check for every other score available on the Betfair Exchange. The 4+ goals is the equivalent of Betfair’s any other score.
The goal distribution chart gives you an indication of how many goals have been scored in how many matches during the simulation. In our example. 2 goals were scored in approximately 25% of the games, it is then close between 1 and 3 goals at just over 20% each. Hovering over the bar will give you the exact numbers.
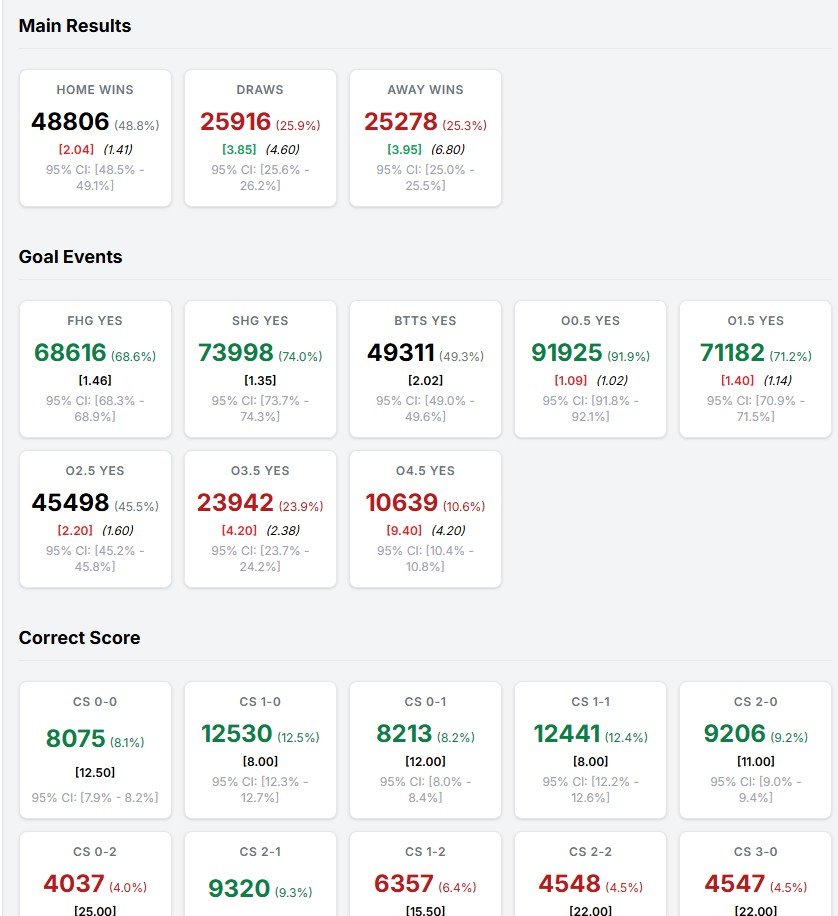
The simulator will give you results for each market. The number of occurrences and the percentage of times this event has occurred will occupy the top line. Next comes the calculated odds as a result of the simulations. If this is higher than the odds imported from CGMBet, the number will be red (indicating a lay is value). If the odds are lower than the imported odds, the number will be green. The following numbers are the confidence indicator. This is set at 95%, giving room for errors and noise in the data. The confidence factor will give a lower and a higher limit for each of the runners.
If, after you have run your simulation, you can run further games to hopefully improve your confidence. If you have other games to profile, simply load in the next game from CSV and begin the process all over again.
This is amazing, how do I get the simulator?
I get asked this question a lot. Out of all my software, the simulator is the tool that everybody wants. And to be honest, I can see why. It is my favourite too. As you will know by now, I give all of my software away for free. Well sort of free, you have to purchase CGMBet first and then it becomes free along with all my other tools. Other simulators historically have been priced upwards of £300. We all agree that is silly money, yet people have still bought it. When you can purchase CGMBet via the Lessons In Logic discount page for a fraction of what older, less impressive simulators have cost, it becomes an extremely cheap option.
If you have any questions about the Lessons In Logic Simulator, or maybe have an idea for improvement, we’d love to hear from you. Either use the Contact Us page or the CGMBet Discord server if you are already a member.