The 1.93 Trap and Testing “Guru” Betting Strategies: A Data-Driven Deep Dive
We’ve all seen them on X (formerly Twitter) or YouTube. The betting tipsters and “gurus” promising foolproof systems, guaranteed daily profits, and strategies that “the bookies don’t want you to know.”
They often sound incredibly logical. They present you with historical averages, high strike rates, and simple rules to follow. But in the world of sports betting, “sounds logical” is exactly how bankrolls get drained. I had originally taken my average odds theory from one of these videos.
Recently, I had to completely re-evaluate my own trading logic after a comment on one of my videos pointed out a massive flaw in how I was looking at odds. It sent me down a rabbit hole of data, maths, and backtesting.

Here is what I learned about the fatal flaw in most amateur trading systems, and what happened when I put a popular “Guru” strategy to the ultimate mathematical test.
Part 1: The “Subset Trap” in Your BTTS Trading Strategy
If you are trying to build a profitable BTTS trading strategy, you have probably had this “Eureka!” moment.
You pull up 10 years of English Premier League data. Then you run the numbers on the “Both Teams To Score” (BTTS) market, and a beautiful statistic stares back at you: 51.8% of all Premier League games end with both teams scoring.
You do some quick maths. If an event happens 51.8% of the time, the statistical break-even odds are 1.93.
Suddenly, a system is born. You think: “If the league average is 51.8%, I will only back BTTS when the bookmaker offers me odds of 1.93, 2.00, or higher. I’ll have the mathematical edge!”
It sounds foolproof. And that is how I made it sound in my latest video.
The Fatal Flaw
The logic relies on one massive assumption: that your strike rate will magically remain at 51.8% after you filter the games.
The 51.8% BTTS average is based on ALL Premier League games combined. It includes the chaotic 3-3 thrillers (priced at 1.50) and the miserable, freezing 0-0 draws (priced at 2.20).
When you apply this rule to your BTTS trading strategy and ONLY bet on games priced at 2.00 or higher, you are no longer betting on “average” Premier League games. You are actively filtering your trades down to the most defensive, low-scoring games in the league. We are ignoring games that could be priced at 1.80 where the implied odds are 1.50. Conversely, we’d be happy to take odds of 2.20 when the implied odds were 3. No value but it meets our rule of backing everything over 1.93.
Because you are exclusively targeting defensive matchups, your strike rate isn’t 51.8% anymore. It drops to 40% or 45%.
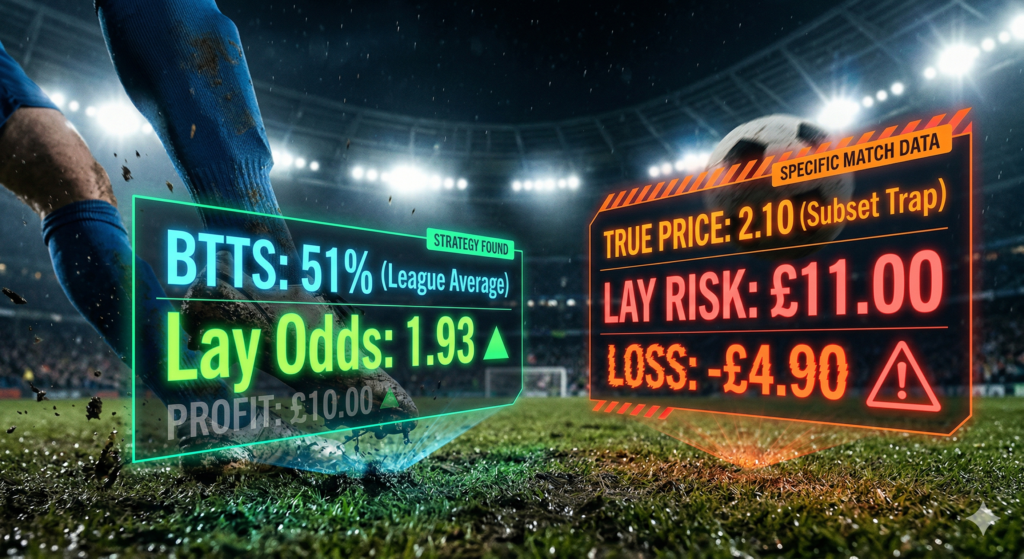
If a bookmaker is offering odds of 2.10 on BTTS, it isn’t because they are handing you a gift above your baseline average. It is because their algorithms know the true probability for that specific game is only 40%. You aren’t finding a mistake in the odds; you are just buying a ticket for an event that rarely happens.
The Maths: Strike Rate is Vanity, Price is Sanity
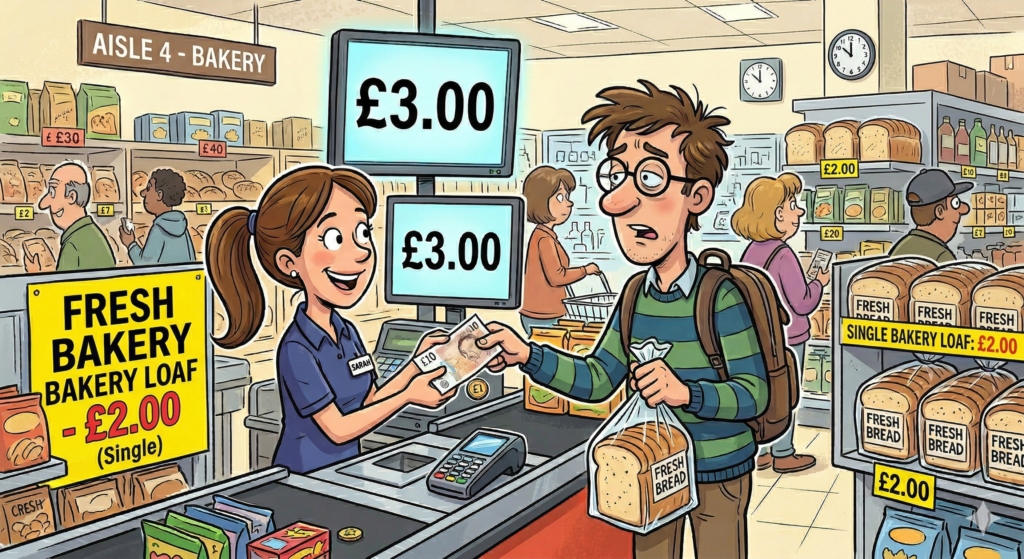
Let’s prove how dangerous it is to ignore the specific price of a match. Imagine you place 100 bets of £10 each, and you win exactly 51 of them.
- Scenario A (The “Bad Price” Trap): You win 51% of the time, but you only ever back heavy favorites at odds of 1.50.
- 51 Wins: £765 return.
- 49 Losses: £490 lost.
- Net Result: A massive loss of £235 (initial £1000 spent – £765 returns).
- Scenario B (The Value Reality): You have the exact same 51% win rate, but you only take bets when the true odds are 2.50.
- 51 Wins: £1,275 return.
- 49 Losses: £490 lost.
- Net Result: A massive profit of £275.
The lesson I learned following research? You don’t get paid for predicting the match correctly; you get paid for finding wrong prices. In my example in the video, I got average odds of 1.93. When I then changed my criteria to show everything over 1.93, they moved to 2.14. I did the same to find odds over 2.14 and they moved to 2.34. Each time, the hit rate and the quality of the matches was deteriorating.
Part 2: Putting a “Guru” Strategy to the Test
Once I understood the Subset Trap, I started looking at the systems being peddled by online “experts”.
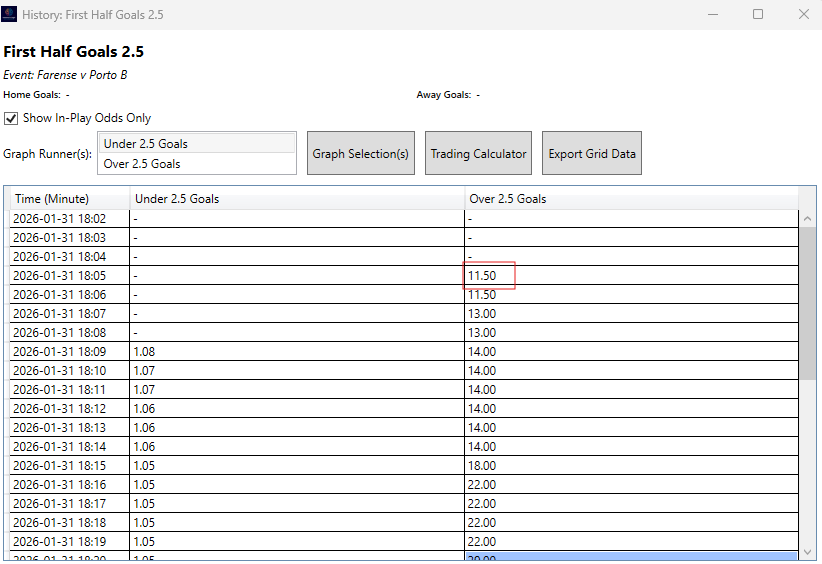
Recently, a popular claim has been circulating regarding a specific system for laying First Half Goals (specifically Over 2.5 FH goals). The logic sounds solid on paper: find games where early goals are statistically unlikely, wait for the match to start, and lay the goal lines. The gurus claim strike rates in the mid-90s, telling you that any lay odds under 16.0 are “profitable.”
But as we just learned, taking a massive historical average and applying it to specific, filtered matches is dangerous. The only way to know if a system actually has an edge is through rigorous, mathematically sound backtesting.
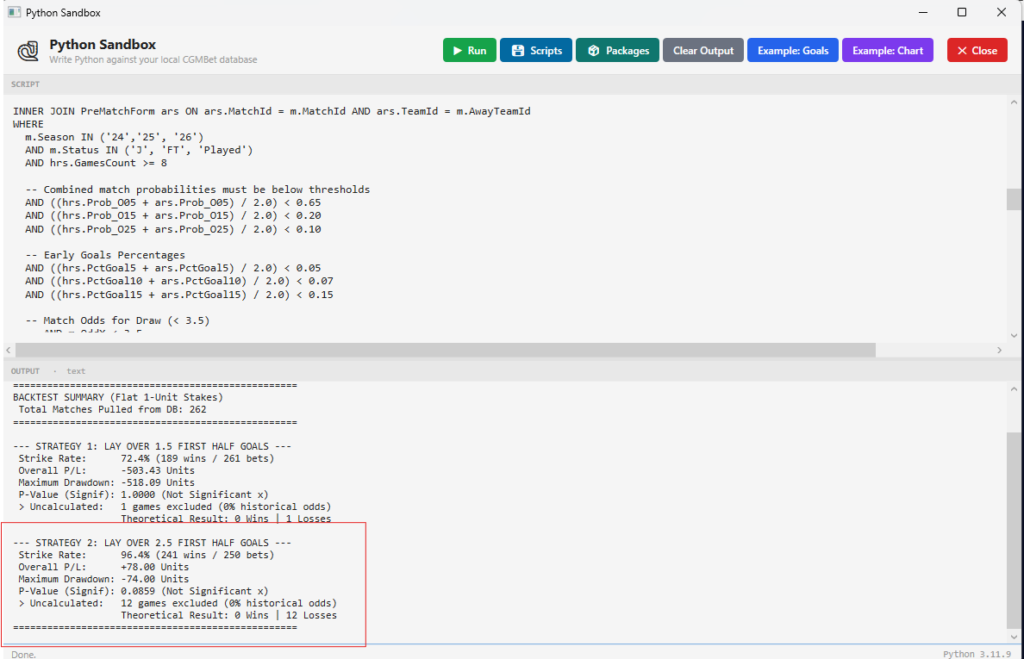
So, I built a custom Python engine in CGMBet 26 to test this exact strategy against the last few seasons.
The System: The Rules of the Test
To ensure we were testing this fairly, I programmed the backtester to filter the database for matches that fit a very specific, strict pre-match profile. For a match to qualify as a bet, it had to meet all of the following criteria based on the previous 10 games of both teams:
- Low Expected Goals: Combined match probability for Over 0.5 FH under 65%, Over 1.5 FH under 20%, and Over 2.5 FH under 10%.
- Cold Starts: Combined early goal percentages had to be remarkably low (Goals in the first 5 mins < 5%, first 10 mins < 7%, first 15 mins < 15%).
- Sample Size: Both teams must have played at least 8 games in the current season to ensure the form data is reliable.
The Hidden Trap: Why Most Backtests Are Lying to You
Before we get to the results, we have to talk about a massive flaw in how most people (and software) run backtests.
When laying outcomes that are highly unlikely (like Over 2.5 First Half goals in a defensive matchup), you are risking a lot to win a little. If a team hasn’t seen an Over 2.5 First Half in their last 10 games (our range for calculating odds), their historical probability is 0%.
If you just run a standard database query, it will try to calculate your odds by dividing by zero. The database panics, returns an error, and skips the match entirely. This means most amateur backtests secretly delete your worst losses from the spreadsheet because the software doesn’t know how to calculate odds for an event with a 0% historical strike rate.
To make this backtest bulletproof, I coded the engine to isolate these edge cases. Instead of ignoring them, it tracks exactly how many of these “0% probability” games actually ended up bursting the goal line, so we can see the true theoretical damage. We can then use our own Market Data Viewer software to obtain the real Betfair odds.
The Results: Does the Edge Exist?
(Note: This backtest assumes flat 1-unit stakes.)
Strategy 1: Laying Over 2.5 First Half Goals
- Matches Analyzed: 60104 (only 262 met the criteria of the strategy in CGMBet 26)
- Strike Rate: 96.4% plus 12 losses with no calculated odds making the overall strike rate 92%
- Overall P/L: 78 Units based on calculated odds, not including the 12 games with no odds. On using the Market Data Viewer software to obtain real odds on all 21 losses, the overall P/L was +24 units
- Maximum Drawdown: -74 Units
- Statistical Significance (P-Value): 0.0859 (Not Significant)] based on the 96.4%.
- The Uncalculated Trap: 12 matches had 0% historical probability. Of those, 0 would have won, and 12 would have resulted in big losses.
It is worth noting that if the 12 matches we couldn’t calculate odds for had won, we would have just returned the winning stake. The reason there are no odds is down to the fact there was no game in the last 20 (10 for the home team, 10 for away) which had over 2.5 goals in the first half.
The Verdict: Luck vs. Math
In sports betting, anyone can flip a coin, win three times in a row, and call themselves a guru. But true profitability is measured in P-Values and Maximum Drawdowns.
If our P-Value is above 0.05, it means that any profit generated by this system is likely due to variance (luck) rather than a mathematical edge over the market. Even with a high strike rate, laying at high odds means a single bad weekend can trigger a drawdown that wipes out a month of grinding.
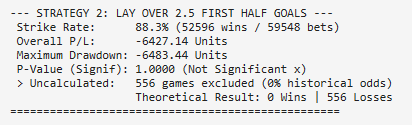
The system has returned a profit on the CGMBet data we tested but for the large levels of liability required, it is a huge risk. There is also a large amount of backfitting here. To reduce the games from 60,000 to 262 is a massive drop. Out of interest, running the test with none of the tight criteria returns a loss of over 6,000 units on the 60,000 games. This with an 88.3% strike rate. This proves that there is a fine line between making a small profit and huge losses.
Now we have the SQL and Python sandboxes in CGMBet 26, testing systems like this is a lot easier. We can now create and test really powerful models as well as hold others to account for systems that aren’t quite what they seem.
The jury is still out on this system. The only reason it has been tested is because of the average odds comment which then started the train of thought from my own example, back to the source.
Always verify before you trust a system. As I learned with my BTTS strategy, the maths doesn’t lie.