Simple charting with the CGMBet Football Analysis Tool
The Football Analysis Tool was written as a replacement for the Power BI project primarily. Whilst the Power BI system is far more powerful, it take a lot more technical skill to be able to produce meaningful outputs. The Football Analysis Tool, is a much simpler, predefined series of charts which make use of CGMBet AGS module for its data.
The tool isn’t fussy about what is in AGS, you may have every game that meets your strategy criteria, you may have several seasons worth of data for the same league. All of these are perfectly acceptable to import into the tool.
The tool is split into three sections. Team analysis which will give you performance data for a particular team, season analysis which will break down the stats season by season and leagues analysis which will show a particular market across different leagues so you can see which league performs the best.
Team Analysis
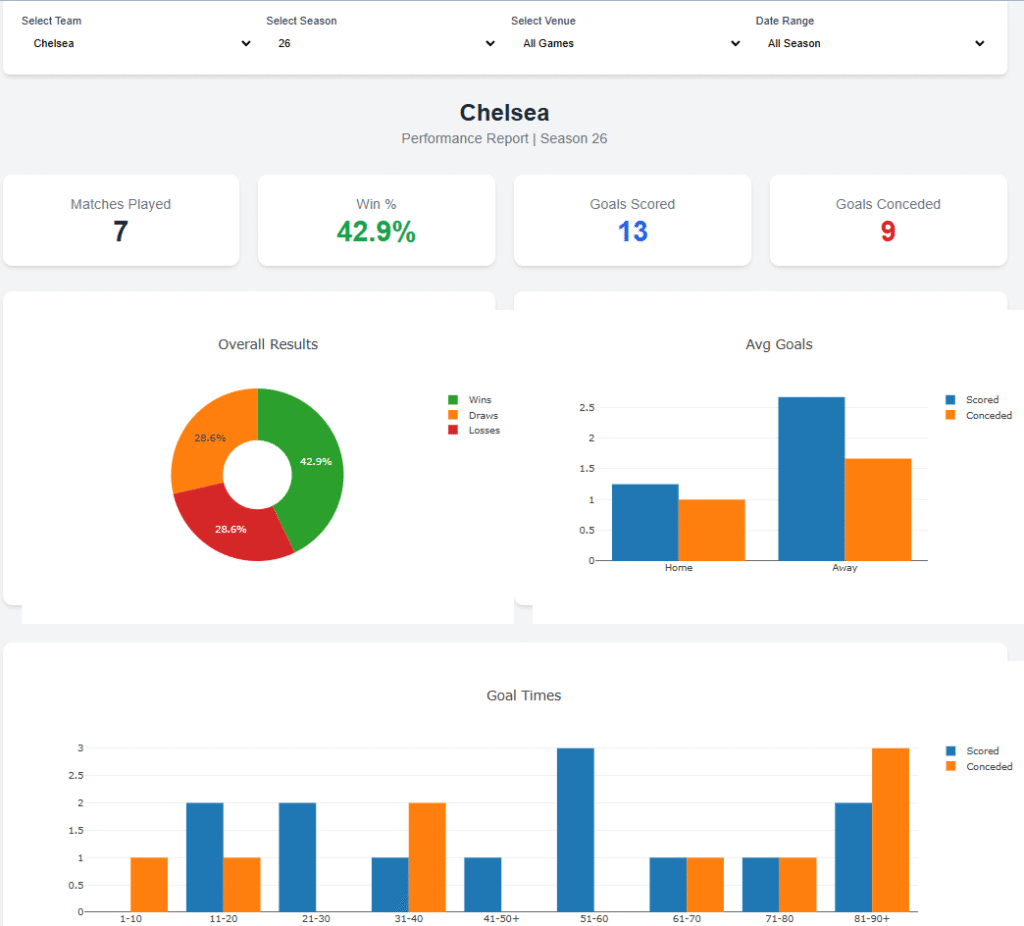
For the team analysis, select any team from the dropdown menu. You can also elect to choose a particular season or you may want to show all the data across all seasons. You can also select home games, away games or all games. The final option allows you to select all season’s data or the last 5, 10 or 20 games. After each dropdown changes, the data also changes to reflect this.
The data we show is the donut chart of won, drawn and lost games and average goals scored and conceded, both at home and away. The final chart shows goal times in the selected games, both scored and conceded.
Season Analysis
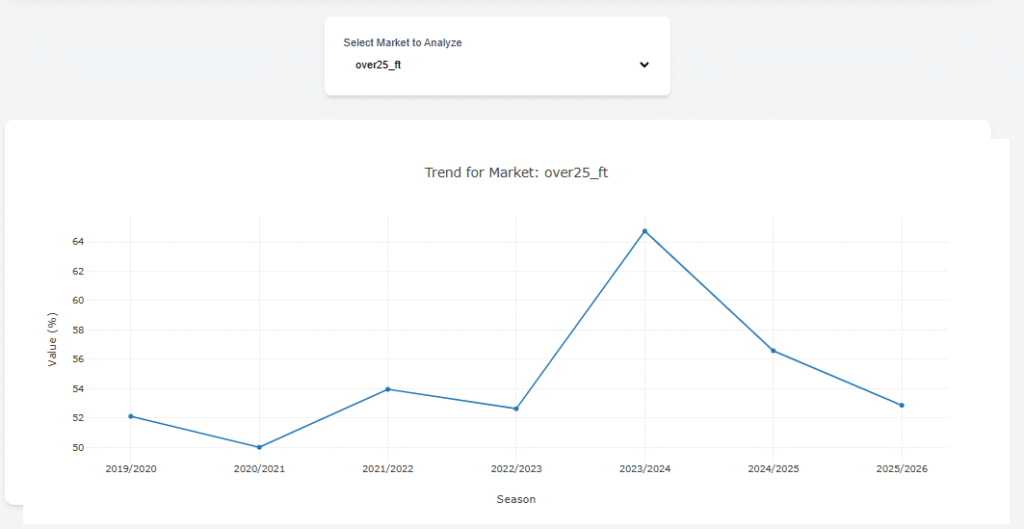
Season analysis allows you to view trends in data across the number of seasons you exported from AGS. All markets are available in the dropdown. As soon as you change the dropdown, the data automatically changes to reflect this.
In the example I have here, I’ve selected the over 2.5 goals market. We can see that in the 23/24 season, the data that I exported from AGS (the English Premier League, all games) shows a significant increase in games with over 2.5 goals. In the 24/25 season, this number dropped back down but was still higher than in the seasons prior to 23/24. Currently, the 25/26 season is down at what would previously have been described as a normal level.
We can quickly see trends and alter any strategy accordingly. For example, if you had an under 2.5 goals strategy, it may have worked well up to 23/24 but in that season, it would not have performed as well.
League Analysis
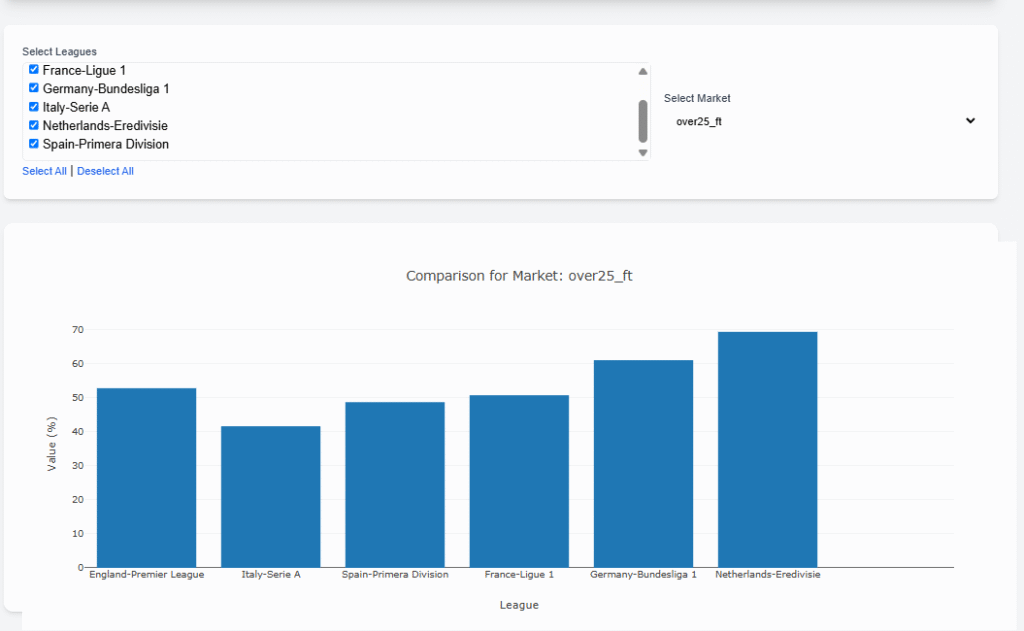
The league analysis option allows you to compare a particular market across all of the exported leagues. Although CGMBet gives you the data for this within the application, some people are visual learners so work better with charts.
In this example, we are looking at the over 2.5 goals market across several of Europe’s top leagues. We can see that in the dataset we have, the Dutch Eredivise has the highest percentage of games with over 2.5 goals. Conversely, the Italian Serie-A has the least games with over 2.5 goals. By hovering over a bar in the chart, we are able to see that the difference between the highest and the lowest is 28%. You probably won’t want to be using the same strategy on both of these leagues.
This is just a simple tool. It doesn’t give you anything that CGMBet doesn’t. It just displays the data in a different way.
How can I get a copy of the CGMBet Football Analysis Tool?
It is simple to get a copy of the Lessons in Logic Market Data Viewer. If you aren’t already, just purchase CGMBet and this will entitle you to use all of my software for free. As a supporter of Lessons in Logic, you automatically qualify for a substantial discount off CGMBet. Go to the CGMBet website to redeem this offer.
Once you have the software, head over to the CGMBet Discord Server and follow the instructions there. It is nice and easy. Support is on hand too if you get stuck with any Lessons in Logic application.
If you find you are enjoying the software and would like to contribute to future developments or the upkeep of this site, you can always donate but this is totally voluntary.