Evaluate minute by minute odds with the Lessons In Logic Market Data Viewer
Have you ever wished you could revisit historical games to analyse real life odds movements? Well now you can with the Lessons in Logic Market Data Viewer. I created this tool specifically with this use case in mind. The application makes use of the Betfair Historical Odds free data in order to provide this service.
Data is available on most markets offered by Betfair and includes both pre-event and in-play odds movement. In fact, the entire event lifecycle for odds is included in this application.
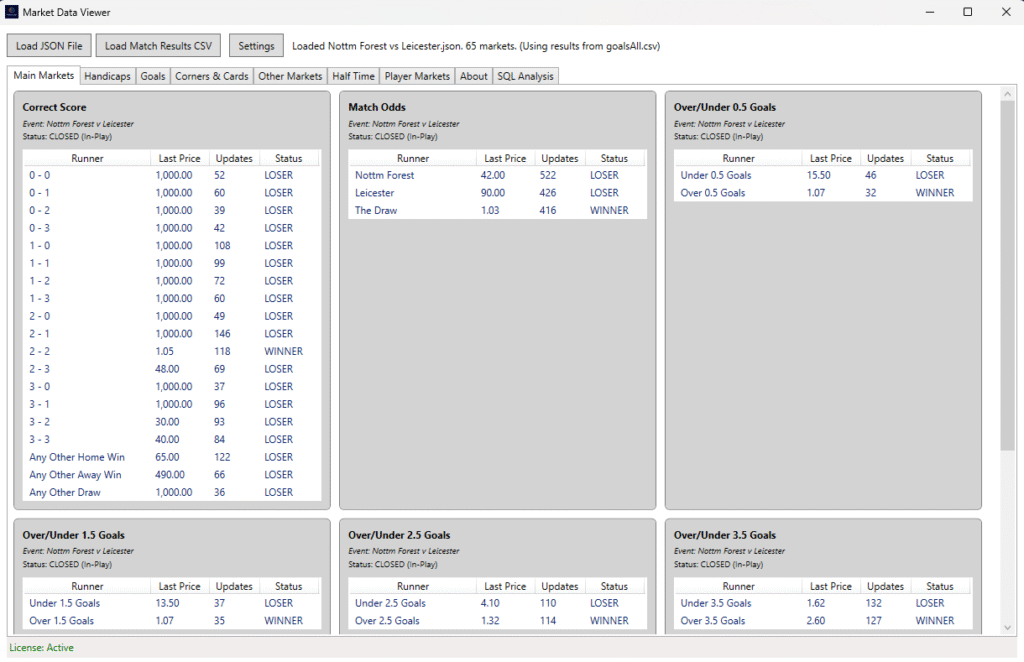
The applications interface is nice and clean and, even with the vast volumes of information. It should run on any PC or laptop purchased in the last 5 years
How does the Market Data Viewer Work?
Downloading data from the Betfair Historical Odds site gives you a zip file containing lots of undecipherable files. The Market Data Viewer ships with a supplementary utility that converts these files. The utility also renames all folders as the fixture name so that you can easily find the match you want to analyse. Once this step is complete, you just need to select your game and load it into the application. All data for one game is loaded in at the same time so you can quickly move between markets without the need to reload anything.
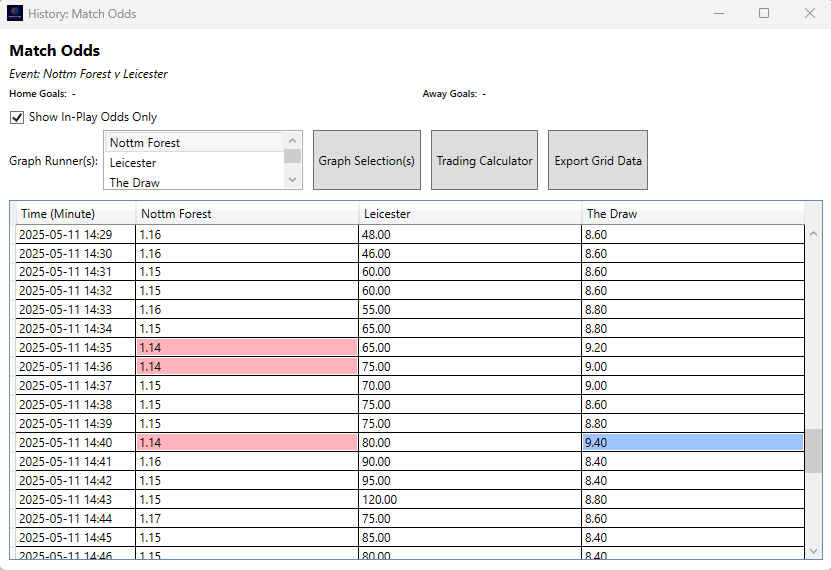
Reading the odds is simple. Each row contains data for a particular minute of the game. The default is to only show in-play odds but you can toggle this on or off very quickly. Scrolling through the match is also nice and easy. The application will also highlight the highest and lowest odds for each runner in the market. This uses the standard Betfair palette as its colour scheme. The salmon pink indicates the lowest odds the runner was, indicating a good time for a lay. The light blue indicates the highest odds that runner was. A good time to back maybe (unless they have just gone out to 1000 in the last minute).
Interpreting the data
Scrolling through the data line by line works really well but sometimes you might want to see the odds movement more clearly. The Market Data Viewer allows you to plot these movements on a line graph. The graph is very customisable, allowing you to select which data to include on the graph. Again, this is very easy to do using standard Windows functionality for selecting multiple objects.
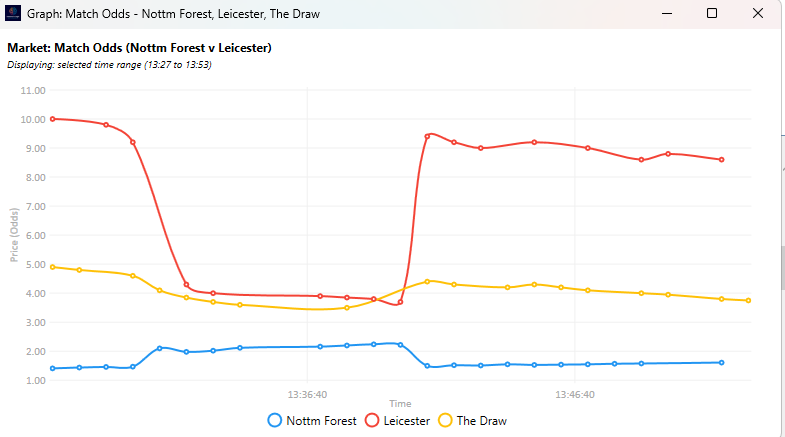
These graphs clearly show how the market reacts to specific events. By reviewing several games, you should be able to spot patters when a particular event happens in a specific section of a game and hopefully, tailor your strategy to accommodate for this. Is there an overreaction which sees the odds go too high or too low, only to settle after a few minutes or do the odds quickly settle into the correct range? This is all information you will be able to obtain from the software.
Calculating your profit
As well as providing the data for you to analyse, the Market Data Viewer also contains some neat little tools which will quickly help you understand how much profit or loss you would take in a situation that you can define yourself with the software.
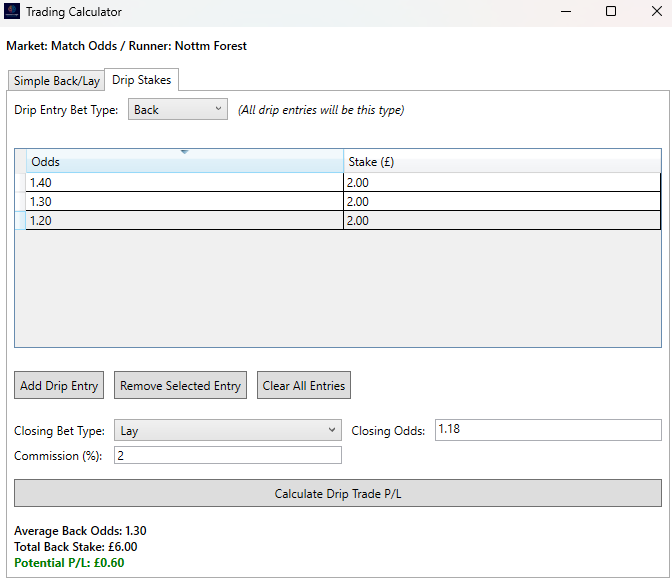
The trading calculator caters for different betting and trading styles. The most common calculator is the Simple Bay/Lay option. This is where you place one bet into the market on either the back or lay side and then place a bet on the reverse side to secure your profit or manage a loss. By entering the starting and ending odds, plus any commission you may have to pay, the software will show you exactly how much you will make from the trade.
The software will also calculate your returns using drip stakes. As we can see from the image, you can select as many drips as you need to, providing the odds and the stake. You also need to let the software know whether it is a back or lay drip and then what the final operation is to close the trade, plus the closing odds and commission value. The software will then work out your profit once again.
If you are using the correct score market, a third tab will appear which will give you a dutching calculator so you know how much to place on your chosen scores in order to secure an even profit, should one of your scores come in.
As you would expect, all the data in the selected market can be exported as a CSV for further analysis.
Market Data Viewer and other sports
The Market Data Viewer does not just work with football, it always works perfectly well in both tennis and cricket markets. Do bear in mind though that we only have data at one minute intervals so in sports such as tennis, the odds won’t show every movement but they are still sufficient to be able to read how a match progressed.
How do I get hold of this software?
It is simple to get a copy of the Lessons in Logic Market Data Viewer. If you aren’t already, just purchase CGMBet and this will entitle you to use all of my software for free. As a supporter of Lessons in Logic, you automatically qualify for a substantial discount off CGMBet. Go to the CGMBet website to redeem this offer.
Once you have the software, head over to the CGMBet Discord Server and follow the instructions there. It is nice and easy. Support is on hand too if you get stuck with any Lessons in Logic application.
If you find you are enjoying the software and would like to contribute to future developments or the upkeep of this site, you can always donate but this is totally voluntary.